Net Metering
July 23, 2015
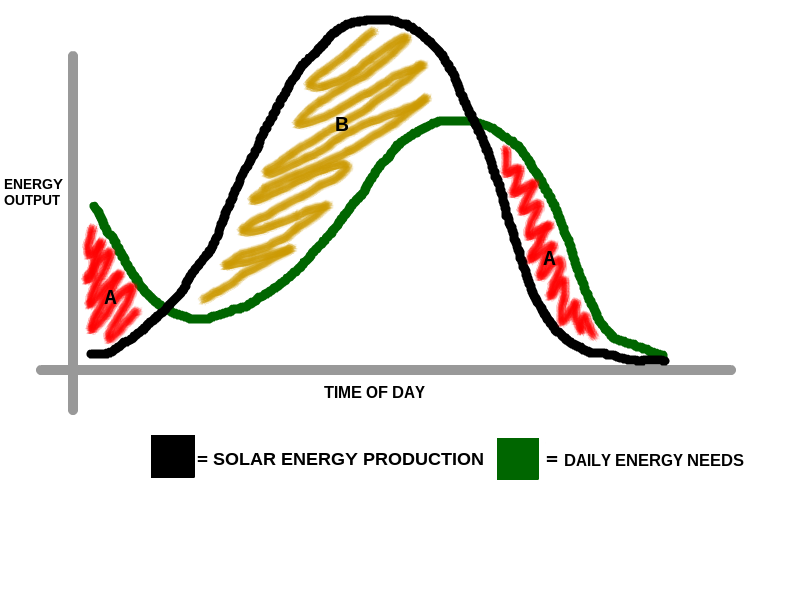
Large cap utilities companies are a staple of American industry and culture. Such a staple that they are represented on the original monopoly board, and just about every home/business owner or renter in the country has at some point been under the grips of one of these companies and has paid an electricity bill. But times are changing, and new technologies and capabilities are giving some people new options about how they generate and use electricity to power their homes. And depending on where you live, buying and installing solar power panels on your home or business may be as economical as buying your electricity from a big utility company. On top of this, the federal government has passed laws about certain tax benefits and incentives to help people to buy and build solar power systems and keep them connected to the grid. One of these policies is know as ‘net metering’ and it provides opportunities for private solar panel users to use a solar power system but also use electricity provided on the grid from utility companies while exchanging excess electricity gained from their solar panels during peak production hours. To understand this one first needs to understand that electricity is very difficult to store effectively for long periods of time with the purpose of future use. Instead, it is less costly for solar panel owners to sell their excess electricity to the utility companies when they have more than they require. Likewise, for the utility company, ideally they would pay for this excess electricity because it would be cheaper than producing their own using fossil fuels or perhaps other renewable energy sources. In the graph above the x-axis represents the passing of time during a single day and the y-axis represents the amount of energy. The green line represents the changing level of energy needed for a household – it is at medium height in the morning, lower during the working hours, increasing later in the day, and then tapers off into the night – it follows the average human schedule. The black line represents the amount of energy that is produced by the households solar power system. There is little energy output in the morning, it increasing along with the increasing sunshine during the day, then tapers off at night. The two sections of the graph labeled “A” represent times where the green line of household energy needs is greater than the black line of solar panel production. During these times the household will need to use energy from the grid. The section labeled “B” represents times where the amount of energy from solar power is greater than the green line of household needs. During these times the household will be able to sell their electricity to the grid because they have a surplus of energy. As long as the total area of section “B” is greater than the total area of section “A” then the household will have a net surplus amount of energy that they can sell back to the grid each day. This sounds great, right? A win – win scenario. Cheaper cost for both sides. Well, not everyone agrees on this, especially the utility companies who have grown very worrisome of more cheaply available solar power because, quite simply, people are buying less of their electricity.